How Scientists Track the Planet’s Fever: Inside Climate Change Measurement
Climate scientists track planetary warming through a sophisticated network of measurement systems that spans oceans, atmosphere, ice sheets, and land surfaces. Understanding these methods matters because reliable data forms the foundation for every climate policy, investment decision, and adaptation strategy shaping our energy future.
The measurement infrastructure deployed across the globe captures temperature shifts with unprecedented precision. Weather stations record daily highs and lows at over 10,000 locations worldwide. Ocean buoys drift through remote waters, measuring sea surface temperatures every few minutes. Satellites orbit overhead, scanning atmospheric conditions and ice coverage from space. Each data point contributes to a comprehensive picture of how our planet responds to rising greenhouse gas concentrations.
But raw numbers tell only part of the story. The science behind climate change requires integrating multiple measurement types to distinguish genuine warming trends from natural variability. Scientists analyze proxy data from ice cores that preserve atmospheric conditions from hundreds of thousands of years ago. They study tree rings, coral reefs, and sediment layers that reveal historical temperature patterns. This long-term context separates normal fluctuations from the accelerated changes we observe in 2026.
Dr. Sarah Chen, lead climate analyst at the International Climate Observatory, explains the challenge: “We’re not just measuring temperature. We’re tracking ocean heat content, atmospheric moisture, ice sheet mass balance, sea level rise, and dozens of other interconnected variables. Each measurement type validates and refines the others.”
For professionals making decisions about renewable energy deployment, carbon reduction targets, or climate risk assessment, understanding measurement methodology builds confidence in the data driving those choices. The following examination reveals how climate measurement systems work, what they tell us about current warming trends, and why this knowledge proves essential for accelerating sustainable energy transitions worldwide.
The Foundation: What We’re Actually Measuring
From Local Weather to Global Climate
When a single summer afternoon brings scorching heat or a winter dumps record snowfall, that’s weather, the hour-to-hour, day-to-day atmospheric mood. Climate, by contrast, is weather’s long-term personality: the patterns, averages, and extremes that emerge when you aggregate decades of measurements across entire regions or the planet. Distinguishing the two is essential for accurate climate measurement, because short-term variability can mask or exaggerate underlying trends if you’re not careful.
Scientists make this distinction by tracking multiple variables over extended periods. A warm July in one location tells us little; consistent warming across hundreds of weather stations over thirty years reveals a climate signal. That’s why climate is typically defined as the statistical average of weather conditions over at least three decades, the World Meteorological Organization’s standard baseline period. By smoothing out year-to-year fluctuations like El Niño cycles or volcanic eruptions, researchers isolate the persistent shifts driven by forces such as greenhouse gas accumulation.
Spatial aggregation matters just as much as temporal. Scientists compile data from thousands of ground stations, ocean buoys, and satellites to create global or regional averages, filtering out local anomalies. A heatwave in one city doesn’t indicate global warming; a 1.1°C rise in the global average since 1850-1900, measured consistently across continents and oceans, does. This rigorous aggregation, combining measurements across space and time, transforms daily weather observations into the robust climate trends that underpin projections and inform energy policy decisions worldwide.
The Global Measurement Infrastructure
Ground-Based Observation Networks
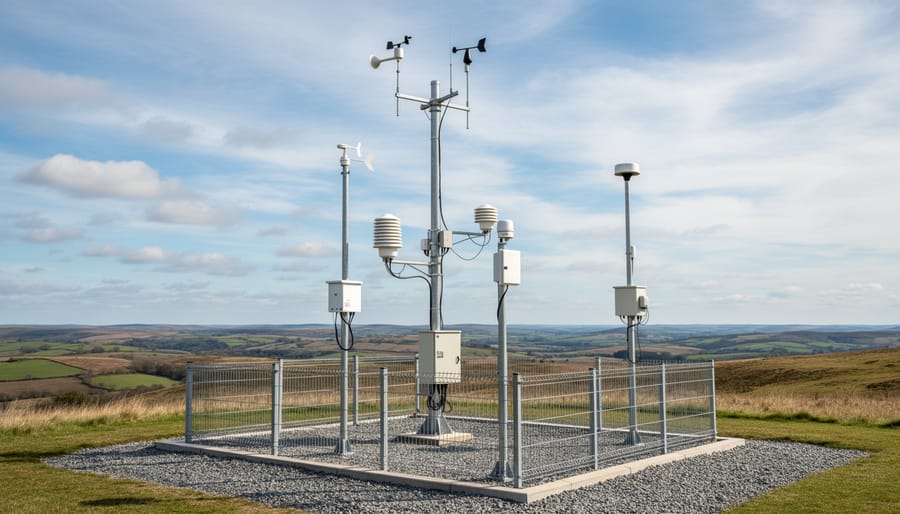
Every credible climate assessment rests on a global network of ground-based instruments that have been quietly collecting data, often for decades. Weather stations distributed across continents measure air temperature, precipitation, atmospheric pressure, humidity and wind patterns several times daily. The World Meteorological Organization coordinates roughly 10,000 land-based stations that feed data into international climate records, with some stations maintaining continuous observations stretching back to the late 19th century. These long-term records provide the historical context essential for detecting trends against natural variability.
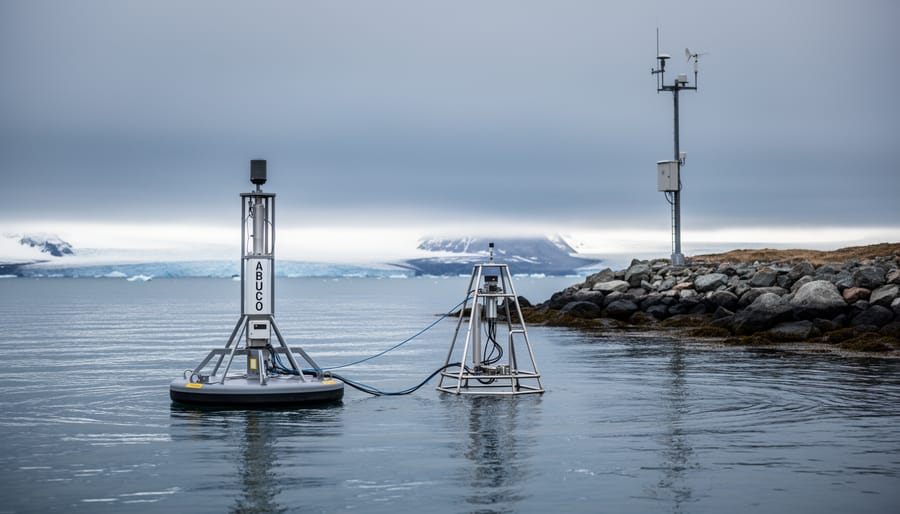
Ocean buoys form another critical layer, anchored across major ocean basins to capture sea surface temperatures, salinity, wave heights and subsurface conditions. The Argo float program alone deploys approximately 4,000 autonomous drifting buoys that profile temperature and salinity down to 2,000 meters depth, cycling to the surface every ten days to transmit data via satellite. This oceanic monitoring matters because oceans absorb more than 90% of excess heat trapped by greenhouse gases, making ocean measurements indispensable for tracking planetary energy imbalance.
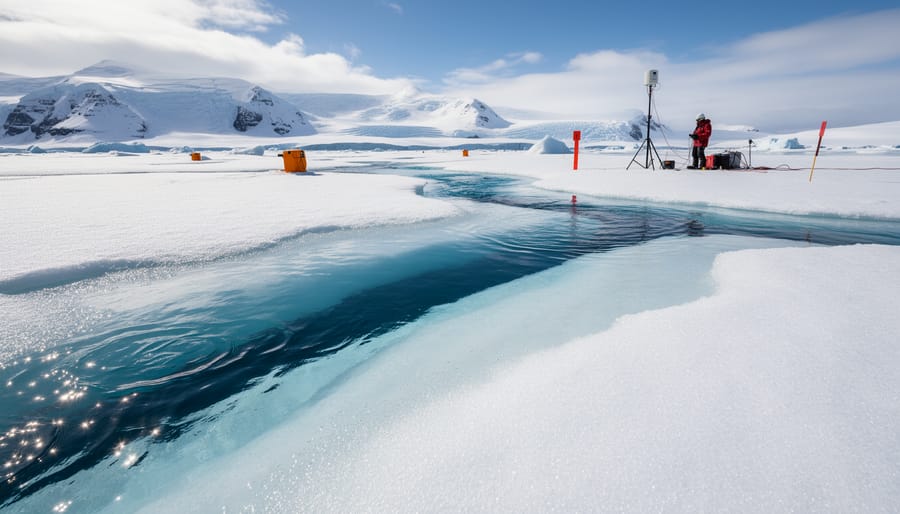
Terrestrial monitoring sites track variables from soil moisture and permafrost temperatures to snow cover duration and vegetation phenology. Research stations in remote locations, Arctic tundra, tropical rainforests, high-altitude glaciers, capture changes in ecosystems particularly sensitive to warming. These sites often integrate atmospheric composition measurements, tracking carbon dioxide, methane and other trace gases that drive climate forcing.
The network’s evolution reflects both technological progress and recognition that comprehensive coverage matters. Automated sensors now operate in locations once inaccessible for continuous monitoring. Data transmission has shifted from manual collection to near-real-time satellite relay, enabling rapid quality control and integration into global datasets. Expansion into the Southern Hemisphere and developing regions has reduced historical geographic biases, though gaps persist in some ocean areas and remote land regions where installation and maintenance remain logistically challenging.
Satellites: Our Eyes in the Sky
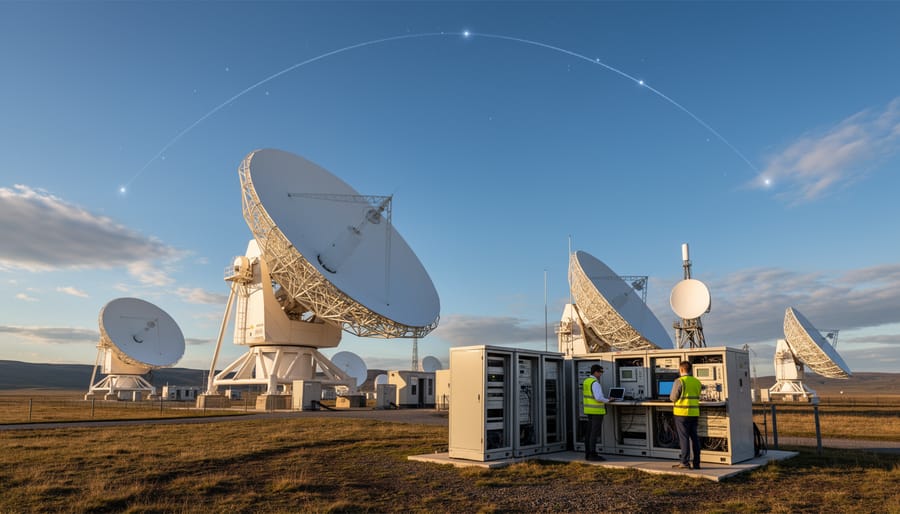
Since the early 1960s, when TIROS-1 first beamed grainy images of cloud formations back to Earth, satellites have revolutionized how we monitor planetary health. Today’s orbital platforms form an indispensable pillar of climate measurement, capturing data across regions too remote, vast, or dangerous for ground-based instruments alone.
Satellites measure critical climate variables with global consistency. Instruments aboard missions like NASA’s Aqua and Terra track sea surface temperatures to within 0.3°C, revealing ocean warming patterns that drive weather systems and marine ecosystems. The European Space Agency’s Sentinel constellation monitors Arctic and Antarctic ice sheets, documenting the 430 billion tonnes of ice Antarctica loses annually. Meanwhile, sensors measure vegetation indices that show how ecosystems respond to changing rainfall and temperature, from Sahel grasslands to boreal forests.
Atmospheric composition monitoring represents another satellite strength. Instruments like the Orbiting Carbon Observatory measure CO₂ concentrations in vertical columns through the atmosphere, identifying emission sources and natural carbon sinks. Other platforms track methane plumes from wetlands and industrial sites, aerosol distributions that affect cloud formation, and ozone layer recovery in the stratosphere.
The 2026 measurement landscape benefits from several technological leaps. Higher spatial resolution now captures neighbourhood-scale temperature variations in urban heat islands. Improved temporal coverage means satellites revisit the same location multiple times daily rather than weekly, catching rapid changes like ice shelf collapse or wildfire spread. Machine learning algorithms process this data deluge faster, flagging anomalies that warrant immediate investigation.
What makes satellite data particularly valuable is its consistency over decades. The same instruments measuring today can be calibrated against their predecessors from the 1980s, creating continuous records that reveal long-term trends no single ground station could capture. This bird’s-eye perspective transforms scattered measurements into comprehensive climate intelligence.
From Raw Data to Climate Intelligence

Climate Models: Testing Our Understanding
Climate models serve as virtual laboratories where scientists test their understanding of Earth’s complex climate system. These sophisticated computer simulations incorporate the measurements discussed earlier, temperature records, atmospheric composition, ocean heat content, ice extent, and use fundamental physics to project how the climate will respond to different levels of greenhouse gas emissions.
Modern climate models divide the planet into three-dimensional grids, with each cell representing a portion of the atmosphere, ocean, land surface, or ice sheets. The models simulate energy flows, chemical processes, and physical interactions within and between these components. When researchers input historical measurement data, the models can reproduce past climate patterns with remarkable accuracy, validating that scientists have correctly identified the key mechanisms driving planetary warming.
The power of these models lies in their ability to project multiple possible futures. Scientists now use the Shared Socioeconomic Pathways framework to explore how different combinations of demographic trends, economic development, technological progress, and climate policies might unfold. Each SSP scenario produces distinct emissions trajectories, which the models translate into projected temperature increases, precipitation changes, and sea-level rise.
When the IPCC’s Sixth Assessment Report synthesized projections from dozens of modelling groups in 2021, a clear pattern emerged: the planet’s future depends on choices made this decade. Models consistently show that limiting warming to 1.5°C requires immediate, substantial emissions reductions across all sectors. The World Bank’s climate portal now displays these SSP-based projections at country and regional scales, enabling policymakers and industry leaders to understand location-specific climate risks under different scenarios.
These models have evolved from tools for understanding to instruments for decision-making, informing everything from infrastructure planning to sustainable energy investments.
The IPCC: Synthesizing Global Climate Knowledge
When individual climate measurements tell us that the Arctic is warming or that sea levels are rising, the Intergovernmental Panel on Climate Change (IPCC) asks the next question: what does all this data mean together? Established in 1988, the IPCC doesn’t conduct its own measurements. Instead, it performs something equally vital, it synthesizes the world’s climate science into comprehensive assessments that guide policy and action.
The panel’s Sixth Assessment Report (AR6) exemplifies this rigorous process. Its Working Group I report, which focuses on the physical science basis of climate change, draws from thousands of peer-reviewed studies and measurements collected by scientists worldwide. The report underwent an unprecedented approval process, approved by 195 governments through a virtual session spanning two weeks, with hundreds of scientists and government representatives scrutinizing every line. This isn’t bureaucratic theatre, it’s how the global community verifies that climate findings meet the highest standards of scientific accuracy and political acceptance.
Every IPCC assessment follows a structured methodology that transforms raw measurements into policy-relevant insights. Authors systematically evaluate available evidence, assign confidence levels to findings based on data quality and scientific agreement, and identify remaining uncertainties. When the AR6 states that human activities have caused approximately 1.1°C of warming since 1850-1900, that figure represents not just thermometer readings but a consensus judgment weighing multiple measurement systems, statistical analyses, and attribution studies.
The reports integrate three types of evidence: direct observations from weather stations and satellites, paleoclimate data from ice cores and tree rings, and climate model projections. By comparing measurements against model simulations, IPCC authors assess how well scientists understand the climate system and how confidently they can project future changes. The Shared Socioeconomic Pathways framework that appears throughout AR6, for instance, connects current measurements to potential futures based on different emissions trajectories.
This synthesis matters because climate decisions require more than data, they need trusted interpretation. When a government plans coastal infrastructure or an energy company designs a renewable project, IPCC assessments provide the authoritative baseline that justifies billion-dollar investments. The rigorous approval process ensures that these assessments reflect both scientific integrity and practical usability across diverse national contexts.
Case Study: Northern Europe’s Integrated Measurement Approach
Northern European nations have established a model for how integrated climate measurement can drive both scientific understanding and practical action. The approach combines real-time data collection across multiple environments with rapid information sharing among universities, meteorological services, energy companies, and agricultural sectors. This interconnected system allows local measurements to feed into global datasets while simultaneously informing regional decision-making.
The infrastructure spans coastal waters, forests, agricultural land, and urban centers. Research vessels equipped with automated sampling systems track North Atlantic temperature shifts and ocean acidification patterns. Forest monitoring stations measure carbon sequestration rates in boreal ecosystems, providing crucial data on natural climate solutions. Urban sensor networks in cities like Copenhagen and Stockholm track heat island effects, air quality, and building energy performance in near real-time. Agricultural researchers monitor soil moisture, growing season changes, and crop stress indicators that directly inform adaptation strategies.
What distinguishes this system is the deliberate design for data integration. A wind farm operator in Denmark can access regional wind pattern analyses derived from the same meteorological network that informs climate projections. Hydropower managers in Norway use snowpack measurements and precipitation forecasts rooted in the same observation infrastructure that tracks long-term climate trends. Energy grid operators receive granular temperature forecasts that help balance renewable supply with demand, while those same temperature records contribute to understanding regional warming patterns.
The academic-government-industry partnerships exemplify how measurement serves multiple purposes simultaneously. Universities develop and test new sensor technologies in collaboration with energy companies that deploy them at scale. Government agencies standardize data formats and maintain long-term archives, ensuring consistency that makes trend analysis possible. Industry provides both funding and real-world testing environments, accelerating the transition from research prototype to operational tool.
This collaborative model has practical benefits beyond climate science. When a severe storm system approached the region in early 2026, the integrated measurement network provided early warnings that allowed energy infrastructure operators to secure equipment, utilities to pre-position repair crews, and grid managers to activate backup systems. The same data that tracks climate change delivers immediate operational value. By building measurement systems that serve immediate economic needs while contributing to global climate understanding, Northern European nations demonstrate that climate action and economic competitiveness strengthen rather than compromise each other.
Expert Perspectives: Measuring for Action
The transformation from climate measurement to climate action depends on scientists and practitioners who translate data into strategy. Dr. Elena Virtanen, lead climate scientist at the Nordic Institute for Atmospheric Research, emphasizes that measurement precision has fundamentally shifted planning horizons. “We now detect regional climate signals within five-year windows rather than waiting decades for statistical significance,” she notes. “That temporal resolution lets energy planners site wind farms and solar arrays with confidence based on projected resource availability, not historical averages that no longer apply.”
This granularity matters for infrastructure decisions with 30-year lifespans. Consider cooling system design for data centers or thermal stress tolerances for transmission lines. Engineers need projections at local scales, not continental averages. Satellite-derived measurements of urban heat islands, combined with downscaled climate models, now inform these specifications with unprecedented spatial detail.
The energy transition itself generates new measurement imperatives. “We’re tracking not just climate impacts but the effectiveness of our responses,” explains Marcus Johansson, data integration lead at a Stockholm-based renewable energy consortium. His team combines atmospheric CO₂ measurements with grid emission data to verify that renewable capacity additions translate to actual emission reductions. “Real-time measurement closes the accountability loop. We see whether policies deliver promised outcomes or just move emissions around.”
Emerging technologies promise even sharper insights. Next-generation CubeSats launching in 2026 will measure methane plumes at facility level, identifying specific sources rather than regional averages. Machine learning algorithms now parse satellite imagery to track renewable energy deployment rates globally, creating transparent benchmarks for national climate commitments. These tools transform measurement from retrospective assessment to prospective guidance.
The implications extend beyond technical improvements. “Measurement transparency builds public trust,” argues Dr. Amara Okonkwo, who bridges climate science and policy communication. When citizens understand how scientists track warming and validate projections against observations, climate action gains legitimacy. The rigor behind the measurements, the international cooperation required to maintain observation networks, the open data access, all demonstrate scientific integrity that counters misinformation.
Professionals across sectors now treat climate measurement as strategic infrastructure, not academic exercise. Insurance underwriters price risk using localized sea-level projections. Agricultural advisors recommend crop varieties based on measured shifts in growing degree days. Urban planners dimension stormwater systems using updated precipitation intensity measurements. Each application reinforces that measurement serves action.
What the Measurements Tell Us in 2026
The data flowing through our global measurement networks paint a stark yet actionable picture. We’ve now crossed 1.1°C above the 1850-1900 baseline, a threshold that transforms abstract numbers into tangible shifts. Regional variations tell distinct stories: Arctic temperatures have risen by more than double the global average, accelerating ice loss, while tropical regions face intensifying precipitation extremes that stress existing infrastructure.
| Indicator | Baseline (1850-1900) | Current Measurement (2026) | Energy System Implications |
|---|---|---|---|
| Global Temperature | Reference point (0°C) | +1.1°C | Increased cooling demand; thermal efficiency challenges |
| Arctic Ice Extent | Historical average | -13% per decade | New offshore renewable opportunities; infrastructure adaptation |
| Sea Level | Historical average | +20 cm | Coastal energy facility vulnerability; grid relocation needs |
| Atmospheric CO₂ | ~280 ppm | 422 ppm | Urgency for renewable deployment; carbon capture investment |
These measurements directly inform energy sector decisions. Utilities now use granular climate projections, based on the Shared Socioeconomic Pathways framework, to anticipate peak demand shifts and grid vulnerabilities. The data validate investment in understanding solar energy potential across changing irradiance patterns, while ocean temperature records guide offshore wind farm placement and thermal power plant cooling strategies.
Crucially, measurement advances enable real-time accountability. When governments commit to net-zero targets, satellite data verify emissions reductions with unprecedented precision. This transparency accelerates energy system integration allowing renewable sources to displace fossil fuels based on demonstrated performance rather than theoretical models. Northern Europe’s coordinated monitoring networks exemplify this approach: nations share measurement infrastructure to track cross-border renewable energy flows and validate regional decarbonisation progress.
The measurements confirm both urgency and opportunity. We’re approaching the 1.5°C threshold faster than earlier projections suggested, yet our ability to track progress has never been sharper. Every decimal point of warming we measure becomes a data point informing smarter grid design, more resilient infrastructure, and faster clean energy deployment.
The measurements we’ve explored represent far more than scientific documentation, they form the foundation for transformative action. Each data point, from atmospheric carbon readings to ocean temperature records, provides the evidence base that drives policy decisions, corporate strategies, and technological innovation in the energy sector. This precision transforms climate response from abstract concern into targeted intervention, allowing us to track progress and hold ourselves accountable to concrete goals.
The coalition exemplifies how measurement translates into impact. By connecting academic rigor with industry application and government policy, it demonstrates that accurate climate data becomes most powerful when shared across sectors. Research partnerships validate the effectiveness of renewable energy solutions, while robust monitoring systems allow businesses to quantify emissions reductions and optimize sustainable practices. This integration ensures that measurement serves not as an end but as a catalyst for the energy transition already reshaping Northern Europe and beyond.
Looking ahead, measurement technology continues to advance. Enhanced satellite systems, improved modeling capabilities, and expanding ground networks promise even greater precision in tracking our progress toward climate targets. But technology alone doesn’t create change. Energy education for students ensures the next generation of professionals understands both the science behind measurements and their application in building sustainable systems. This combination of accurate data and informed action positions us to meet ambitious climate goals while driving economic opportunity through clean energy innovation.
Measurement gives us accountability. It reveals both the scale of the challenge and the impact of our responses, proving that informed action works.